Reports Tab
Perhaps, the most important window for analysis of the game in Poker Tracker 4 is the section “View Stats”.
![]()
With the help of (By) “$” and “T” tabs you can switch between Cash and Tournaments games, respectively. By the tabs “Results”, “Statistics”, “LeakTracker”, “My Reports”, “Graphs” you can analyze you game results. In this part, we will focus on “Cash” games and “Results” tab.
It’s all quite simple. In the left part of the screen you can select “Player Name”, “Report Type”, “Filters” and “Quick Filters”. “Quick Filters” will be discussed in individual part.
In the right part of the screen you can see graph of the selected report. Directly under graph you can report itself.
In the dropdown menu, there are available the following reports “Overview”, “All-in Equity Adjusted”, “Summary”, “Calendar”, “Final hands at Showdown”, “Money Flow Chart”, “Hero vs Villain”, “Currency Exchange Rate”, “Player Summary”, “Site Summary”.
Consider the most useful reports.
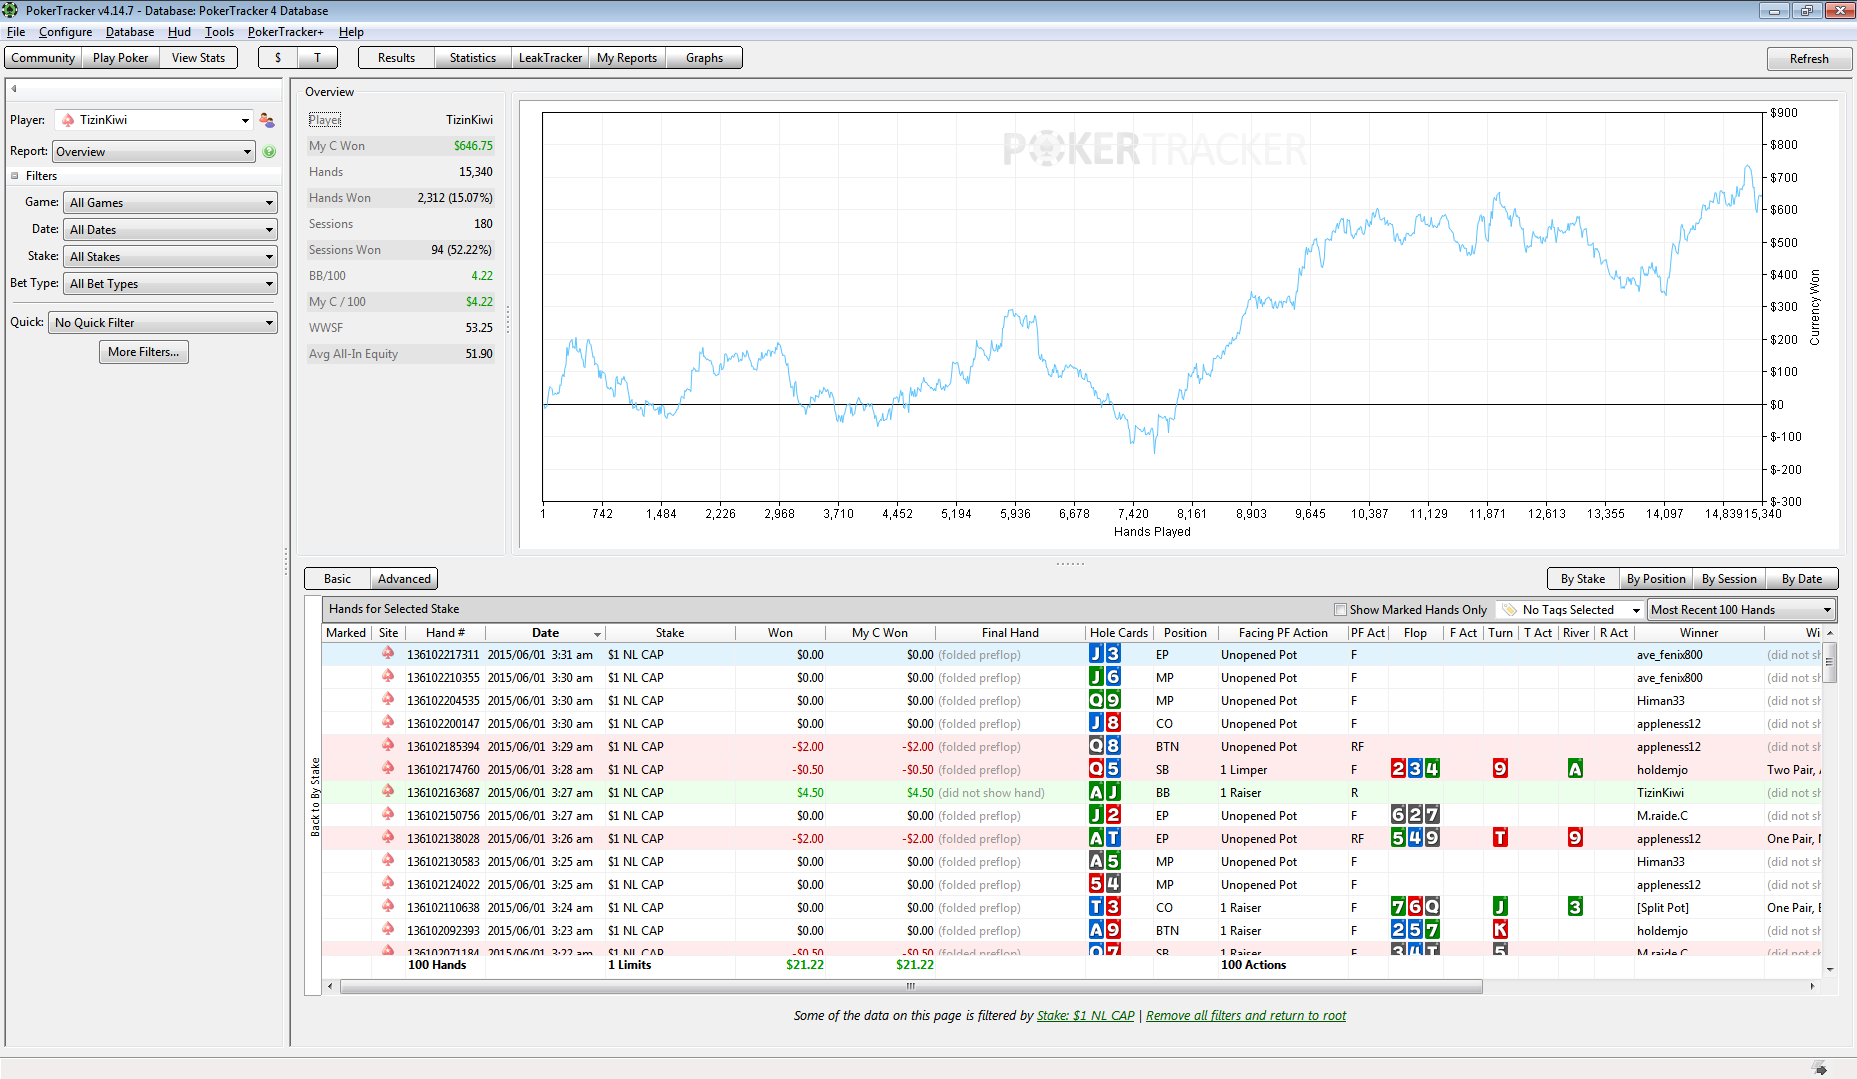
In “Overview” report, in the top part of the screen is available the visual graph our database. In the left part of the screen after establishing “Date” range in the filters, you can create “Active Session screen” functional from Holdem Manager 2. In the bottom part of the screen it is available “Basis” and “Advanced” tabs. Also you can sort your report with tabs “By Stake”, “By Position”, “By Session” and “By Date”.
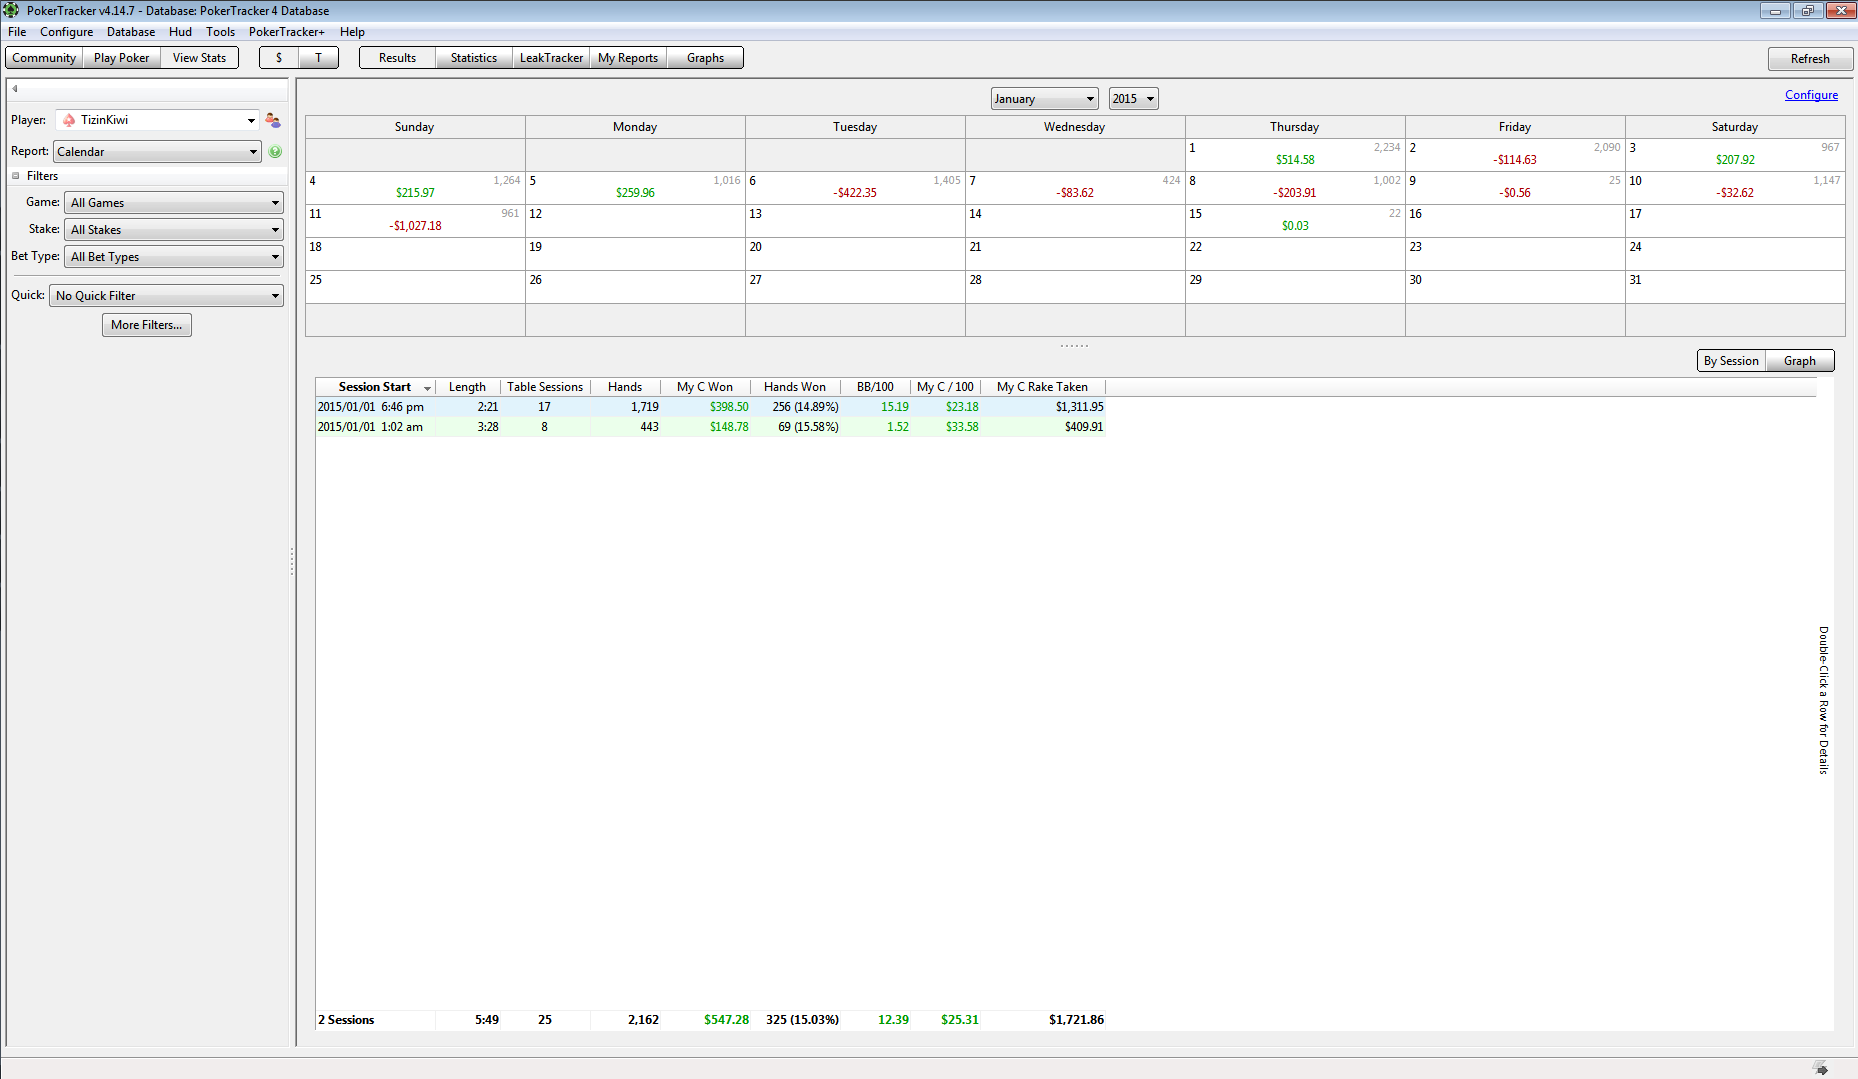
In “Calendar” report you can see the result of each day on the calendar and reveal some feature. For example, with this report, I came to the conclusion that Friday and Saturday are more successful days because usually there are more weak players in these days.
“Hero vs Villain” is the simplified analogue of “Opponents Tab” from Holdem Manager 2.
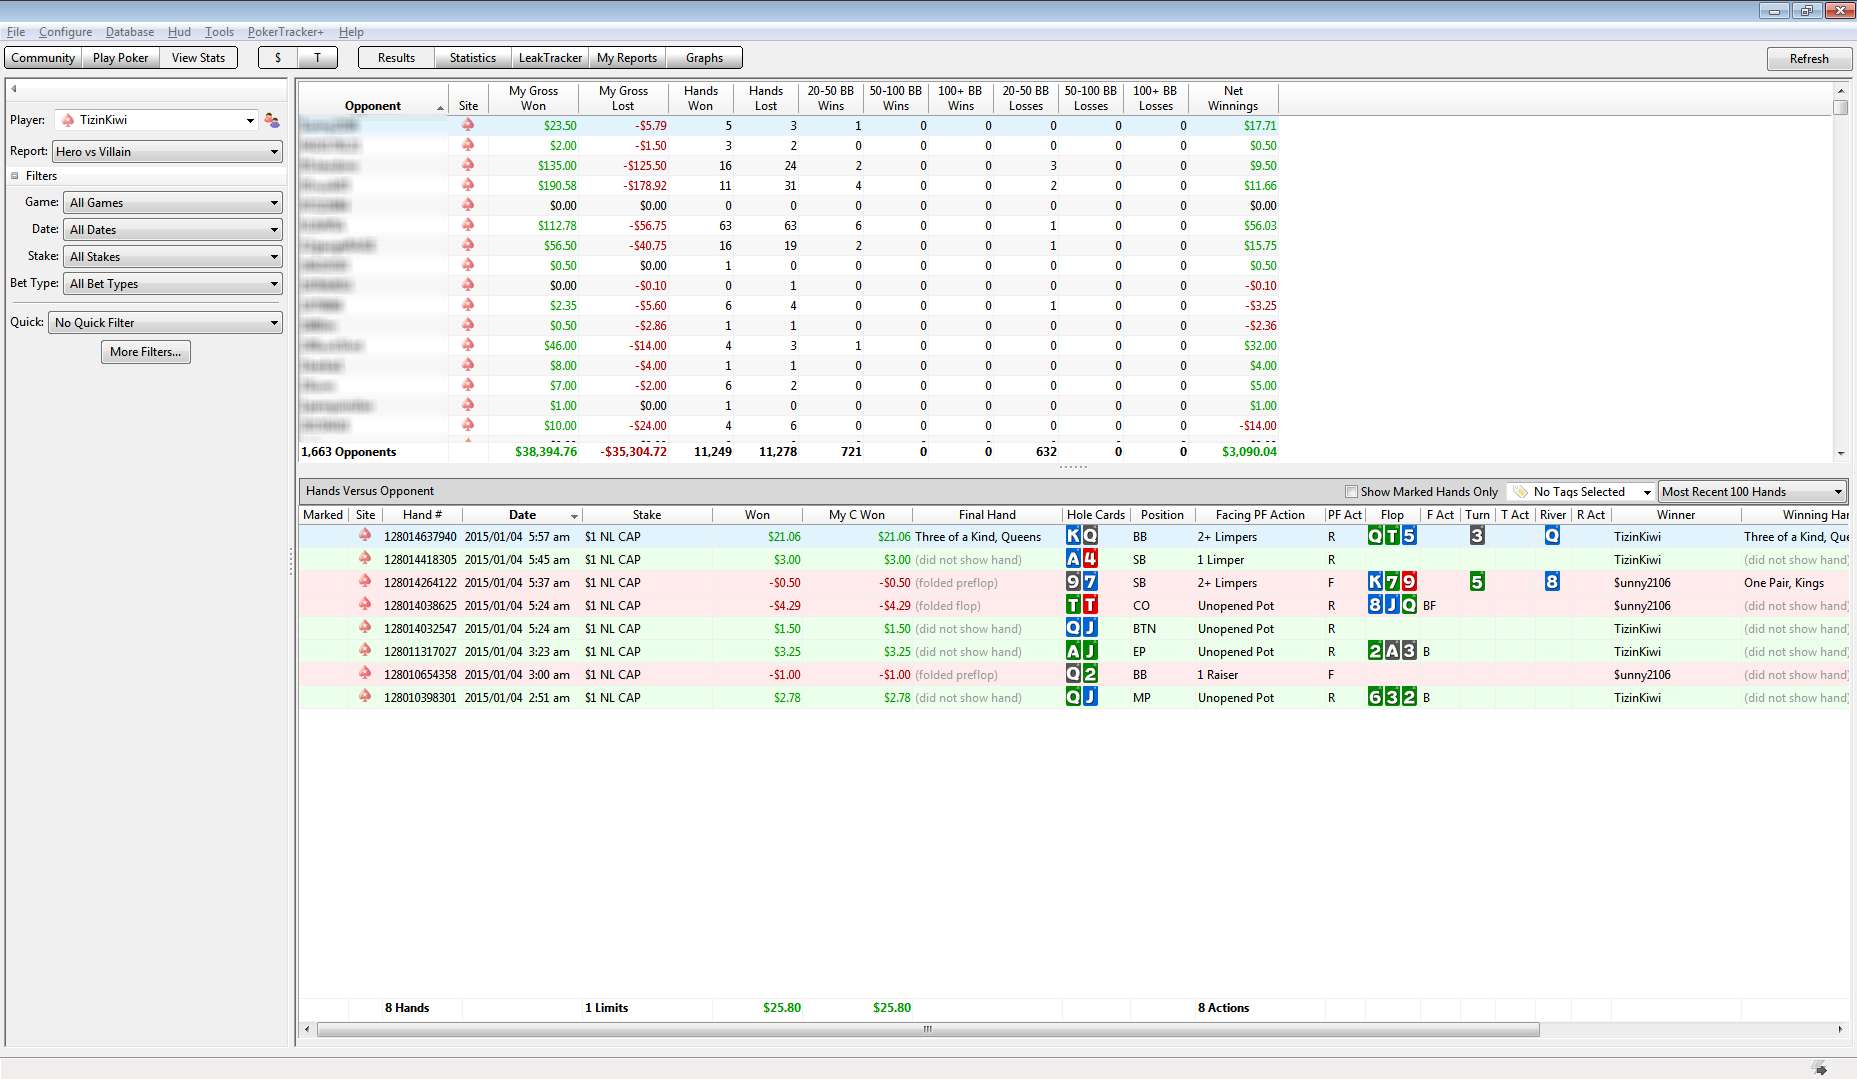
In the top part of the report you can sort all opponents by winning/losing money, by winning/losing banks, by amount banks in different stack sizes and by other parameters. In the bottom part you can see specific hands of selected opponent.
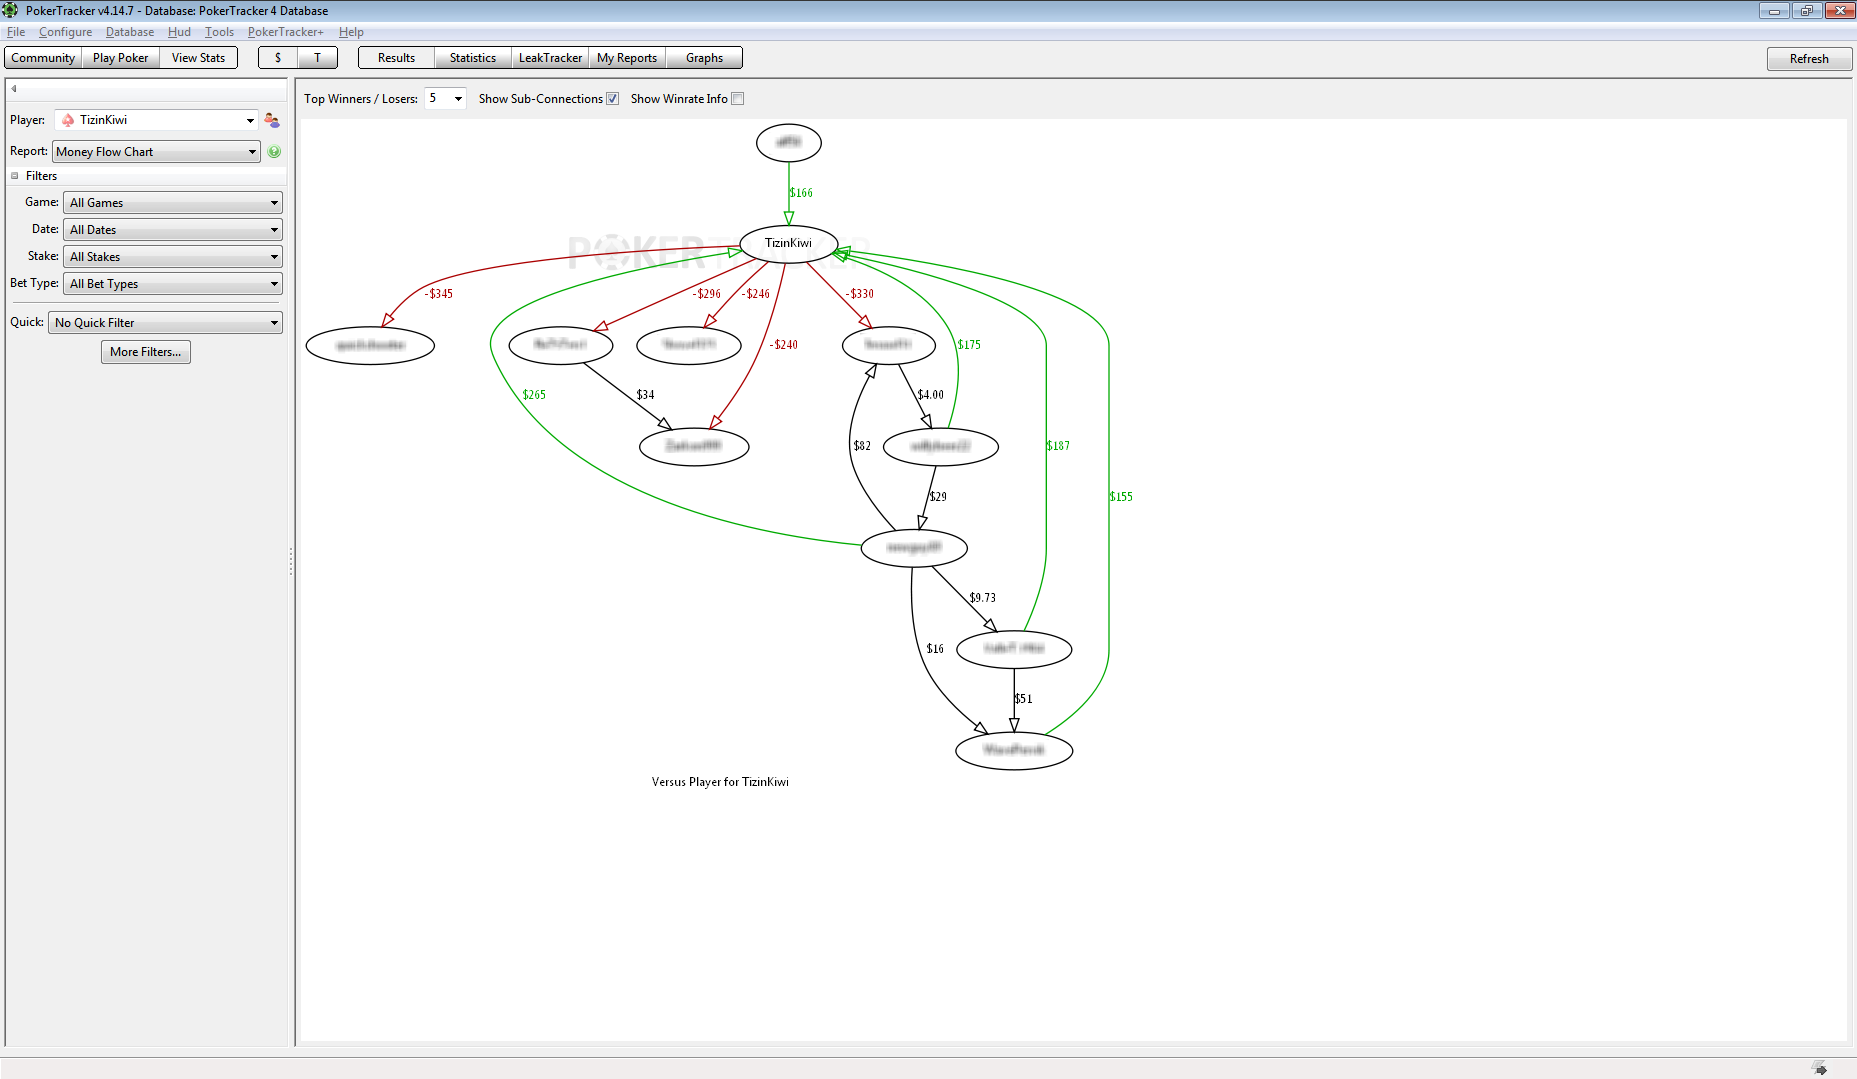
Also, “Money Flow Chart” can be related to the analysis of opponents.

There is graphically showed who loses and who wins money. You can tune different number of players, “Sub-Connections” and “Winrate Info”. Be careful, “Show Sub-Connections” can take a lot of time.
“Site Summary” suitable for the formation of a simple annual report.
Also in the window of any report, you can make a right mouse click.
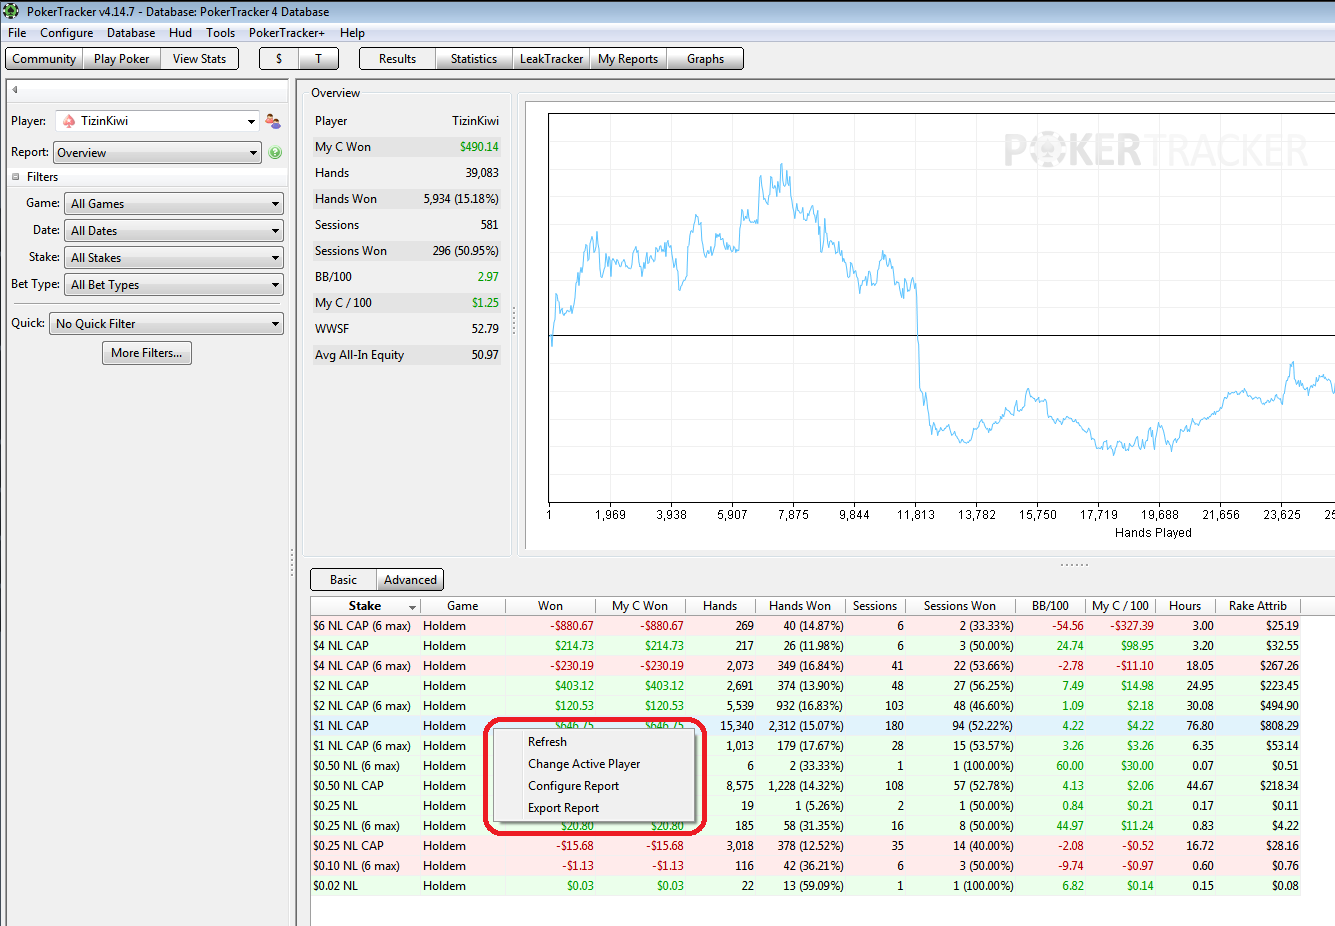
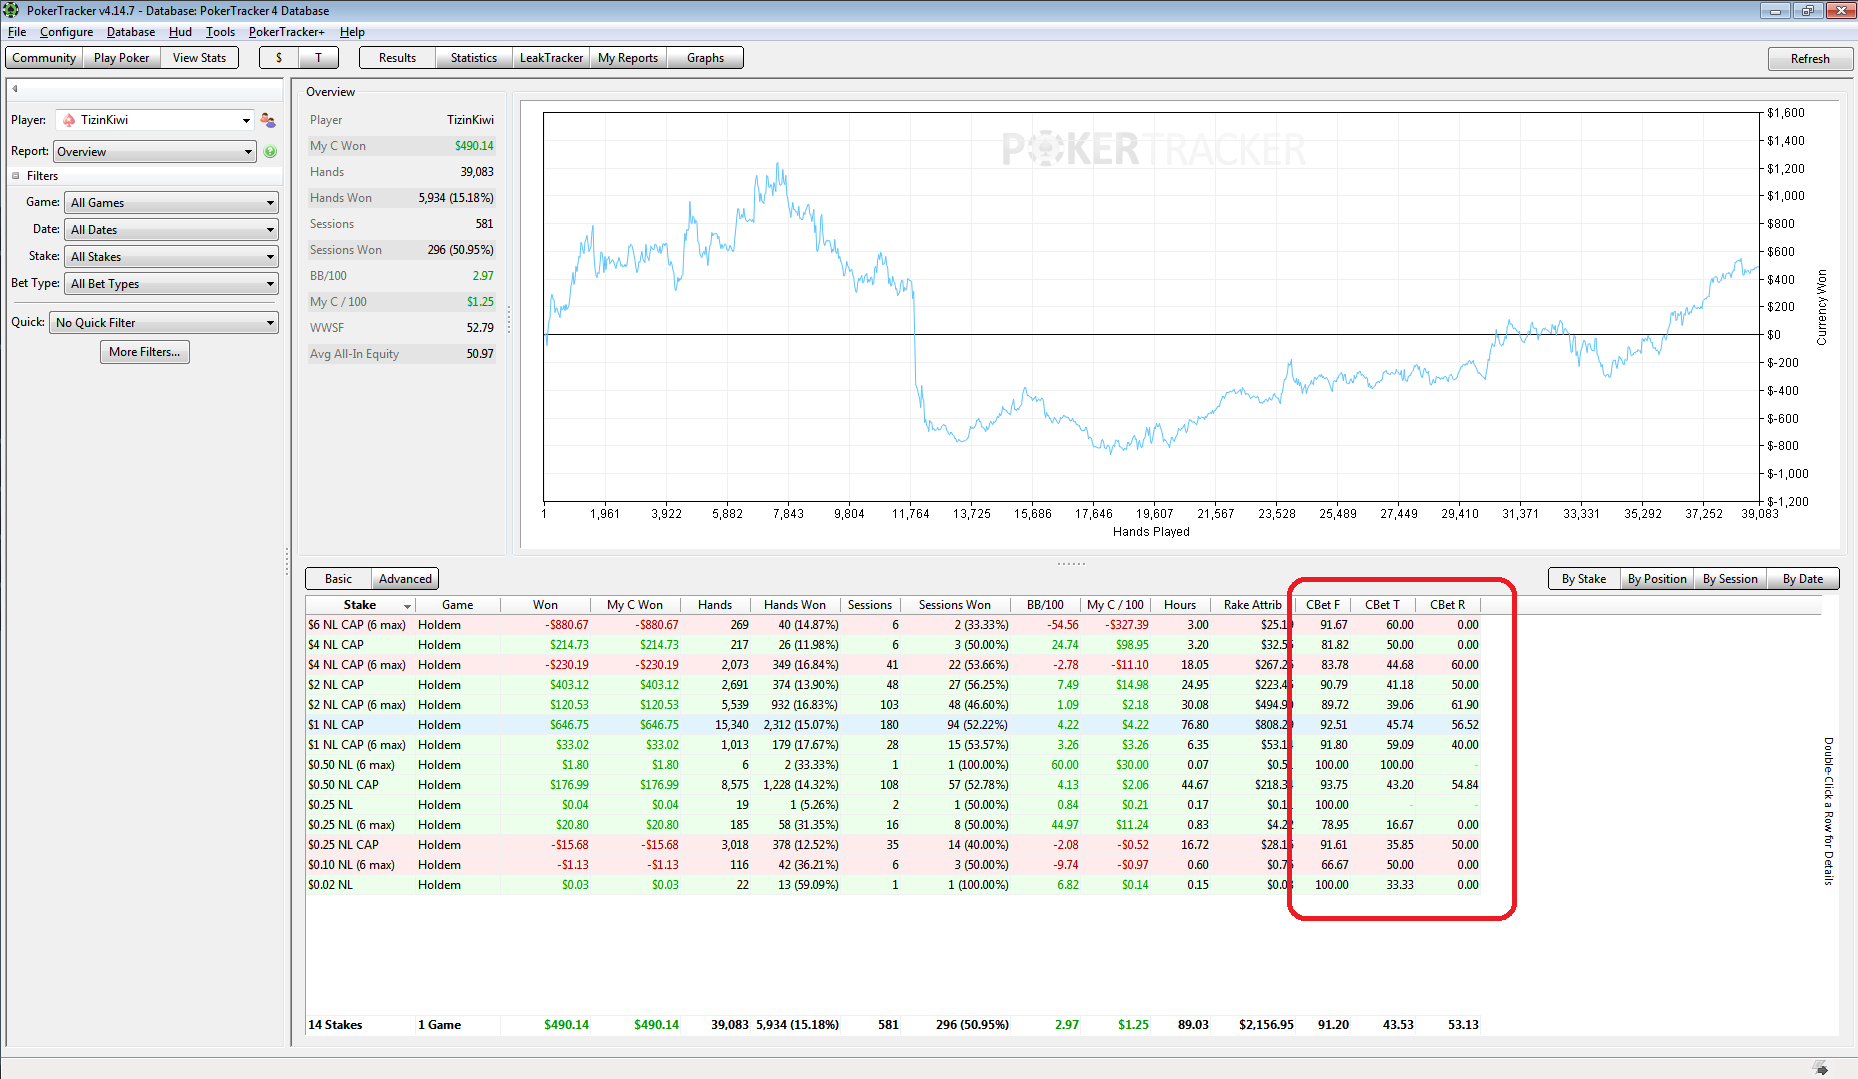
In this window you can “Refresh” reports, “Change Active Player”, “Configure Report” and “Export Report” to *.csv or *.txt file. If you choose “Configure Report” the following window will open.
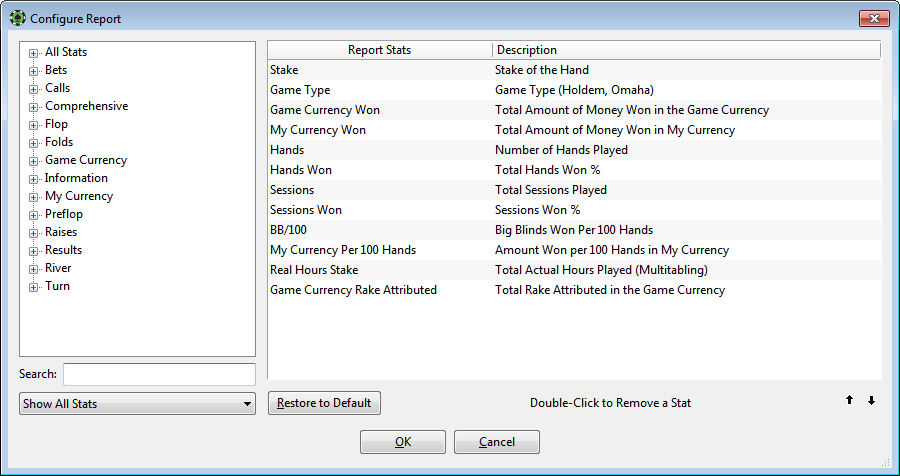
In this window you can set up the report like you want, add necessary stats and remove unwanted stats. Also you can sort all stats as you wish. For addition necessary stat make double click on it in the left side of the window. Use search for fast searching stats. For removing unwanted stat make double click on it in the right side of the window. To return to the original settings press “Restore to Default”. To save the settings press “OK”.
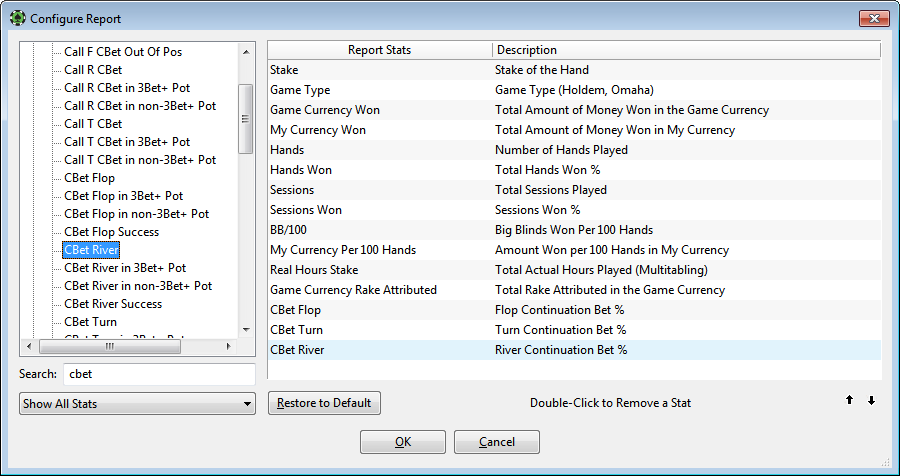
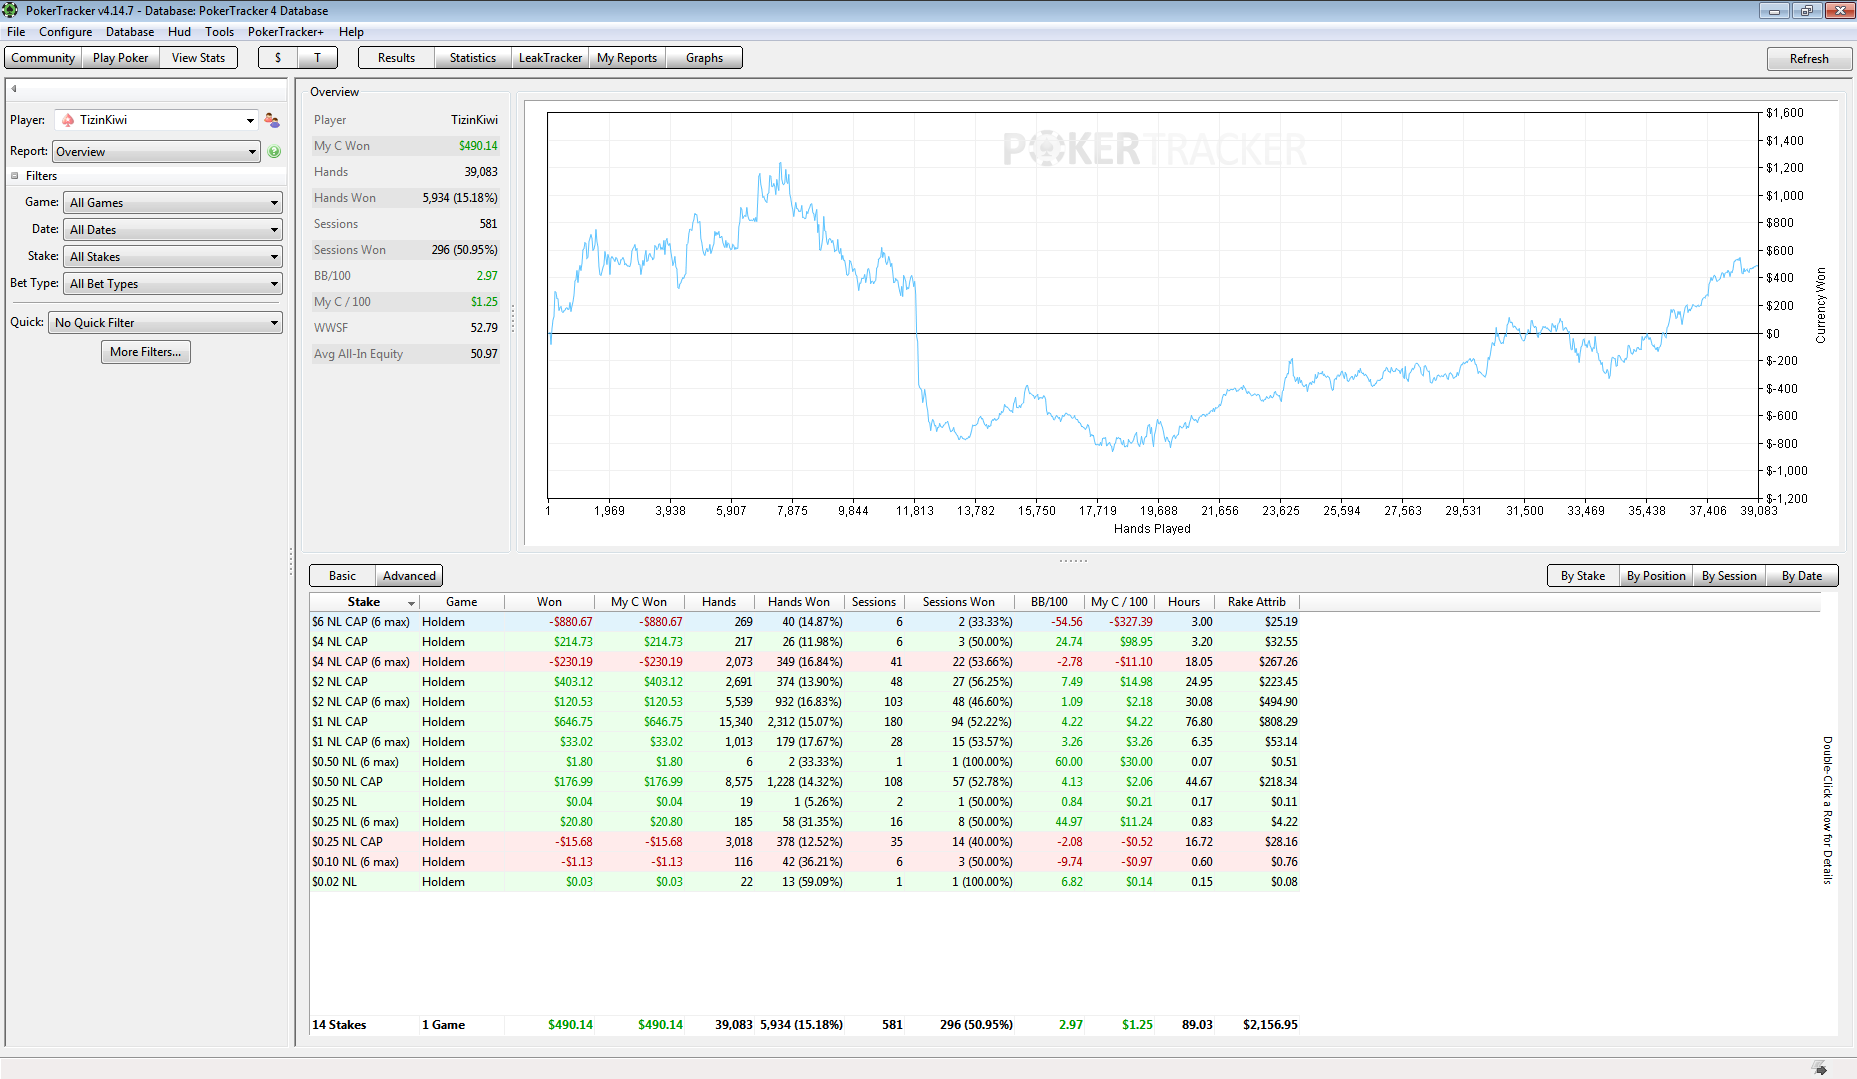
Now, the report should look otherwise, for example, I added these stats.
Also, you can double click on the specific limit, like on the picture below.
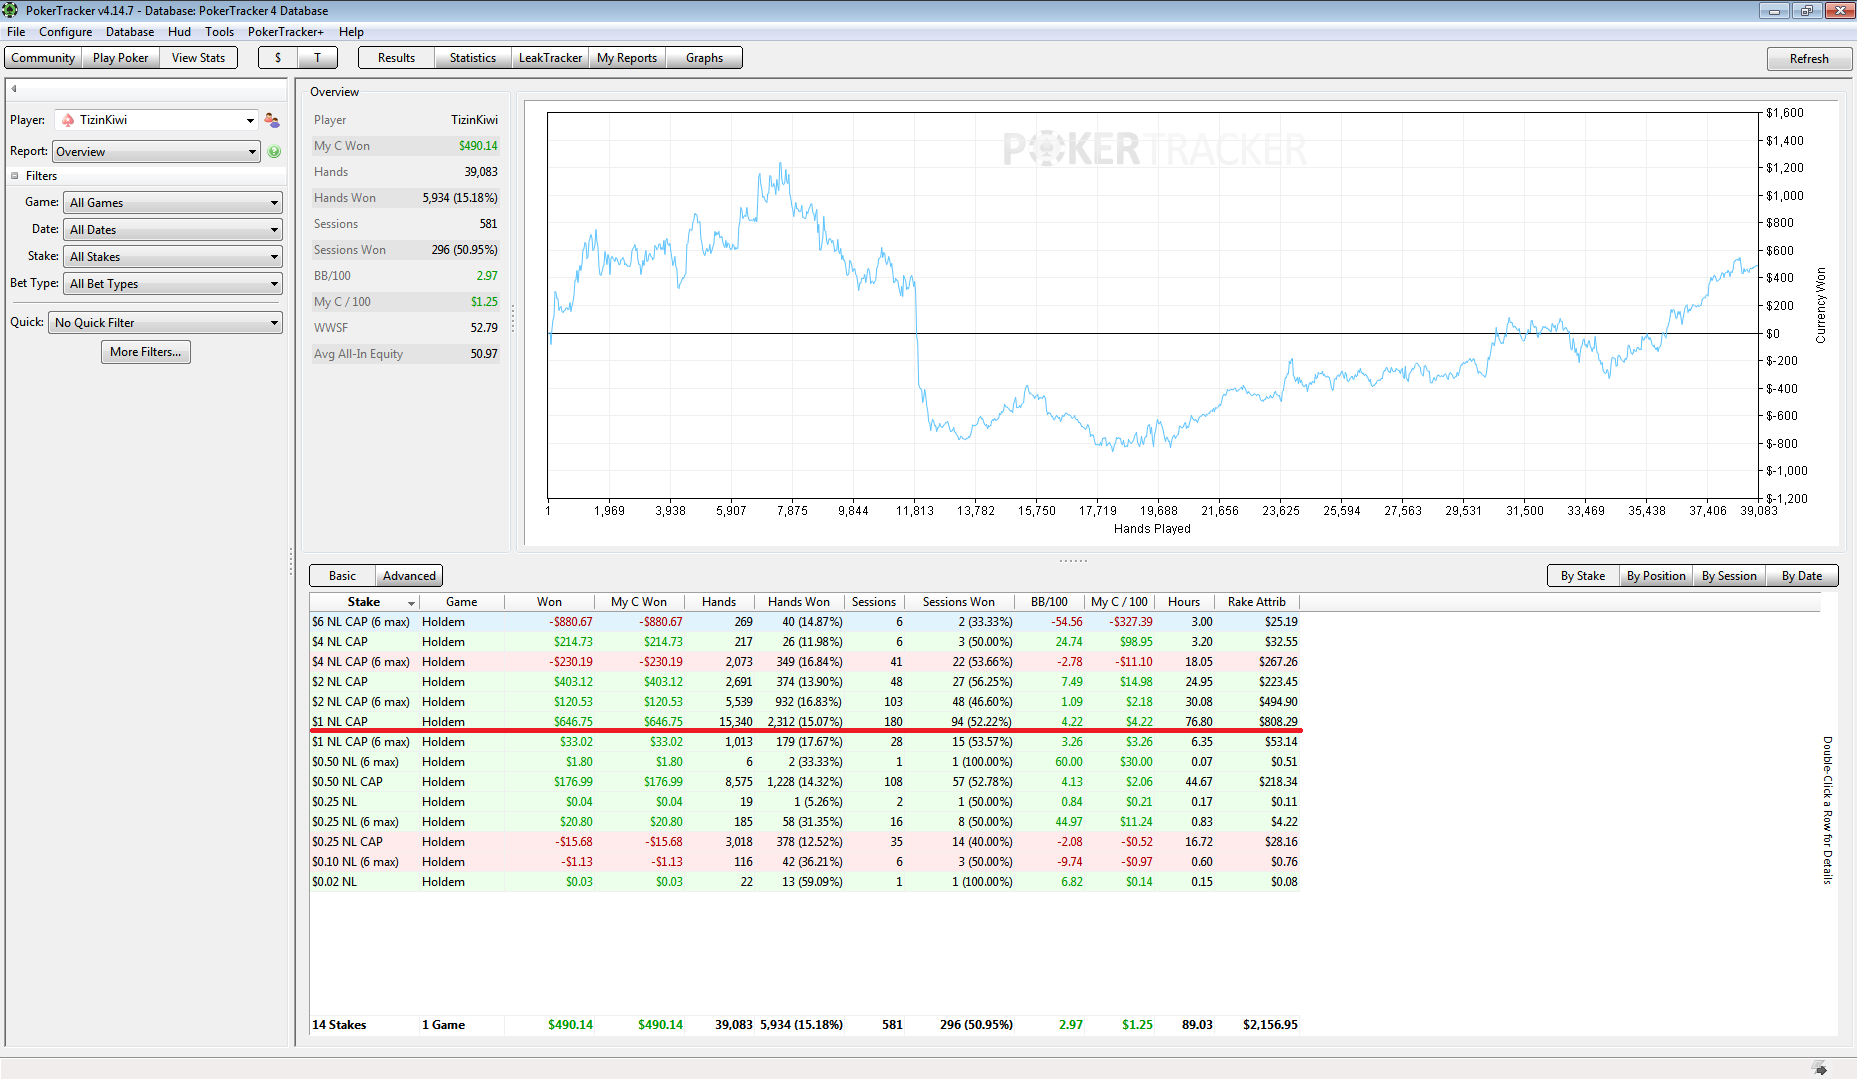
You can see the graph and your hands for this limit in the bottom side of the screen.